The Habistat
Our expertise in data analytics and visualizations make us the preferred choice for Canadian real estate professionals seeking to provide insights and transparency. Email us to learn more about how a custom analytics platform can help your organization.
Our Product
We offer custom analytics platforms & reports

Gain full transparency into the Canadian real estate market. Our advanced analytics tool provides you with actionable insights, empowering you to make data-driven decisions.
Tailor data to meet your needs with our fully interactive dashboard. Explore maps, charts, and graphs to streamline your workflow and optimize performance.

Easily share compelling charts and trends to your network. Our platform lets you generate professional visuals for presentations, lead generation, or building social presence.
Who We Serve
Empowering Real Estate Professionals

Realtors
PropTx members will have access to our analytics platform, designed to give you the insights and tools you need to excel in your markets.

Developers
Make data your competitive edge. We can create tailored platforms and in-depth reporting solutions to meet your unique needs. Contact us for a personalized quote.
FAQ
Analytics Platform
The Analytics Platform includes data from all PropTx member boards. Please visit PropTx.ca for a list of all member boards.
We highly encourage you to reach out to your board's representatives and ask them to contact PropTx by visiting PropTx.ca.
Yes, a step-by-step guide on how to use the platform and unlock its full potential can be found HERE.
- Lake Data
- Commercial Data
- Saved Instance Functionality
- PDOM Metric
- Square Footage Data
- NEW Brokerage Section
- Showings Data
- Socioeconomic Data
General
The data currently goes back to 2010 on most visuals. Please check our recent updates and roadmap for changes to the data.
You can find a list of definitions by going to the information icon located at the bottom left of the platform.
You can select a location by going to the location filter located at the top panel of each page. The location filter is on a Region, City, Neighborhood hierarchy. You can go the lower levels of the hierarchy by clicking on the dropdown arrow.
1. The Habistat Analytics Platform is refreshed daily and captures sales and lease data that were not reflected at the time of the snapshots for the monthly reports. For example, a December 31st snapshot for the Market Watch data would not have captured some of the trailing data in the first week of January, for the December month.
2. The Habistat Analytics Platform uses the combined location of the sales or lease across all the PropTx member boards
Summarized data can be exported. This includes the Historical Stats and Summary Stats pages in the Create Custom Charts section. You can export by clicking the ellipsis (three dots) at the top right of the visual and click export as csv.
Additional filter options can be found in the settings (gear icon). You can switch between Average and Median in the settings section.
Active Listings (All dates) is the total number of active listings for your selected fileres excluding your selected date range. Active Listings (selected dates) is the # of active listings that started between your selected date range.
Recent Updates
The Habistat's new statistics subscription for Broker of Records provides you insights into Brokerage and individual user performance across the PropTx system, to help you with your business planning and recruitment needs.
The upgraded subscription option offers access to PropTx-wide leaderboards and performance statistics for Brokerages and Users at a cost of $599 per year.
When you as a Broker of Record subscribe, the links highlighted below will be activated. You will have access to Brokerage, branch and member leaderboards, along with the ability to perform ad hoc searches.

Brokerage Leaderboard

To Subscribe:
- Log into The Habistat Analytics platform, click Brokerage Leaderboard, then Subscribe Now.
- Add to your cart and checkout. The annual subscription is non-refundable and automatically renews unless cancelled.
Need help? Reach out to us at the contact information below.
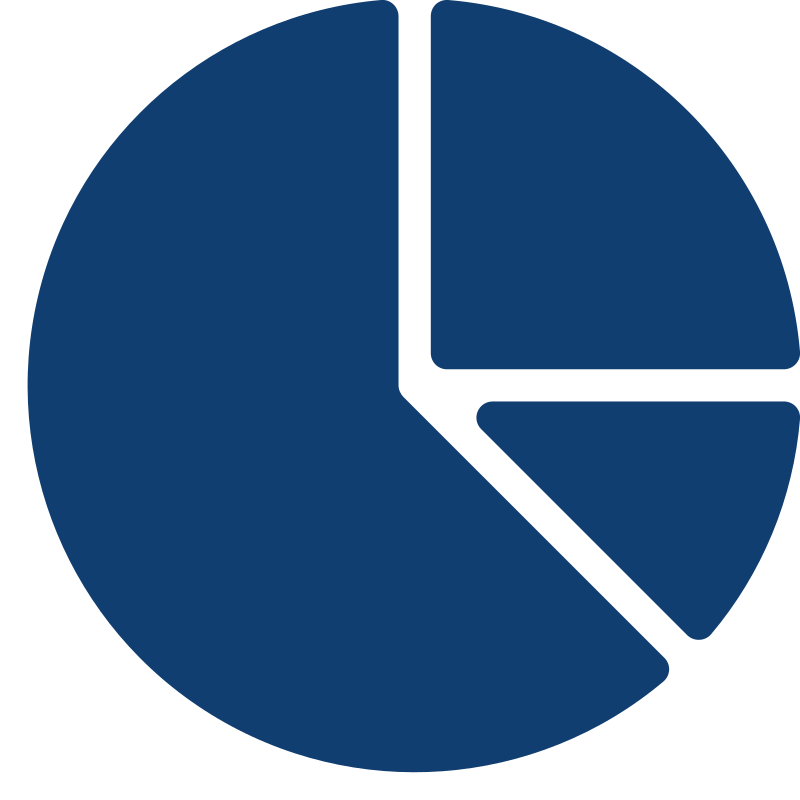
We’ve added two new filters to the Report Settings (gear icon) section: Water Body Name and Water Body Type. These filters allow you to refine your results based on proximity to specific lakes, rivers, or other water features—perfect for waterfront property insights.
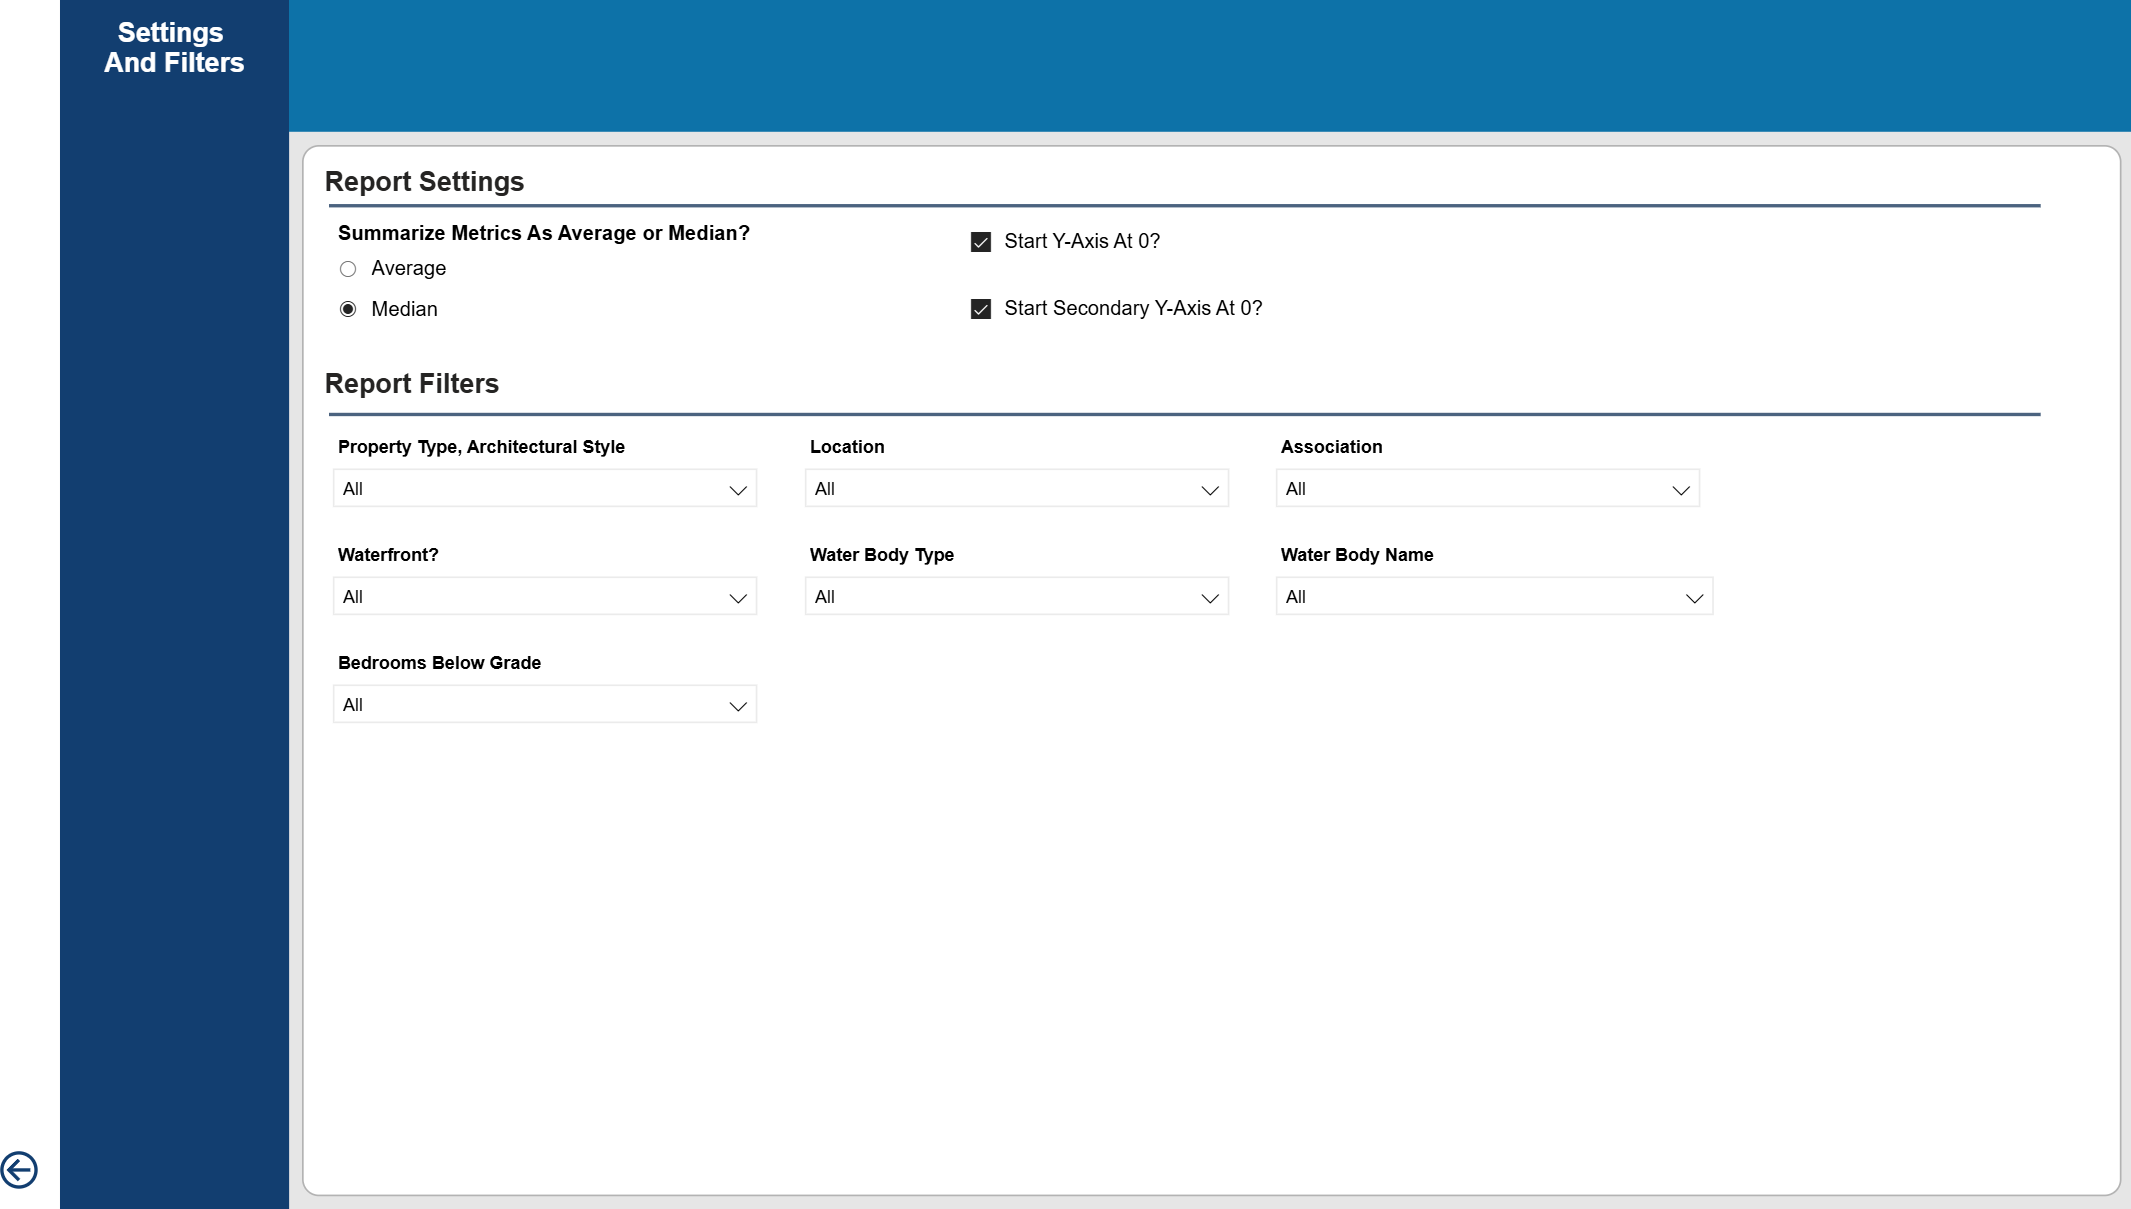
You can now filter data by real estate board! Use the new Association Filter from the settings page (gear icon) to view insights specific to your selected board. For example, selecting TRREB will update the platform to display only data sourced from the TRREB system.
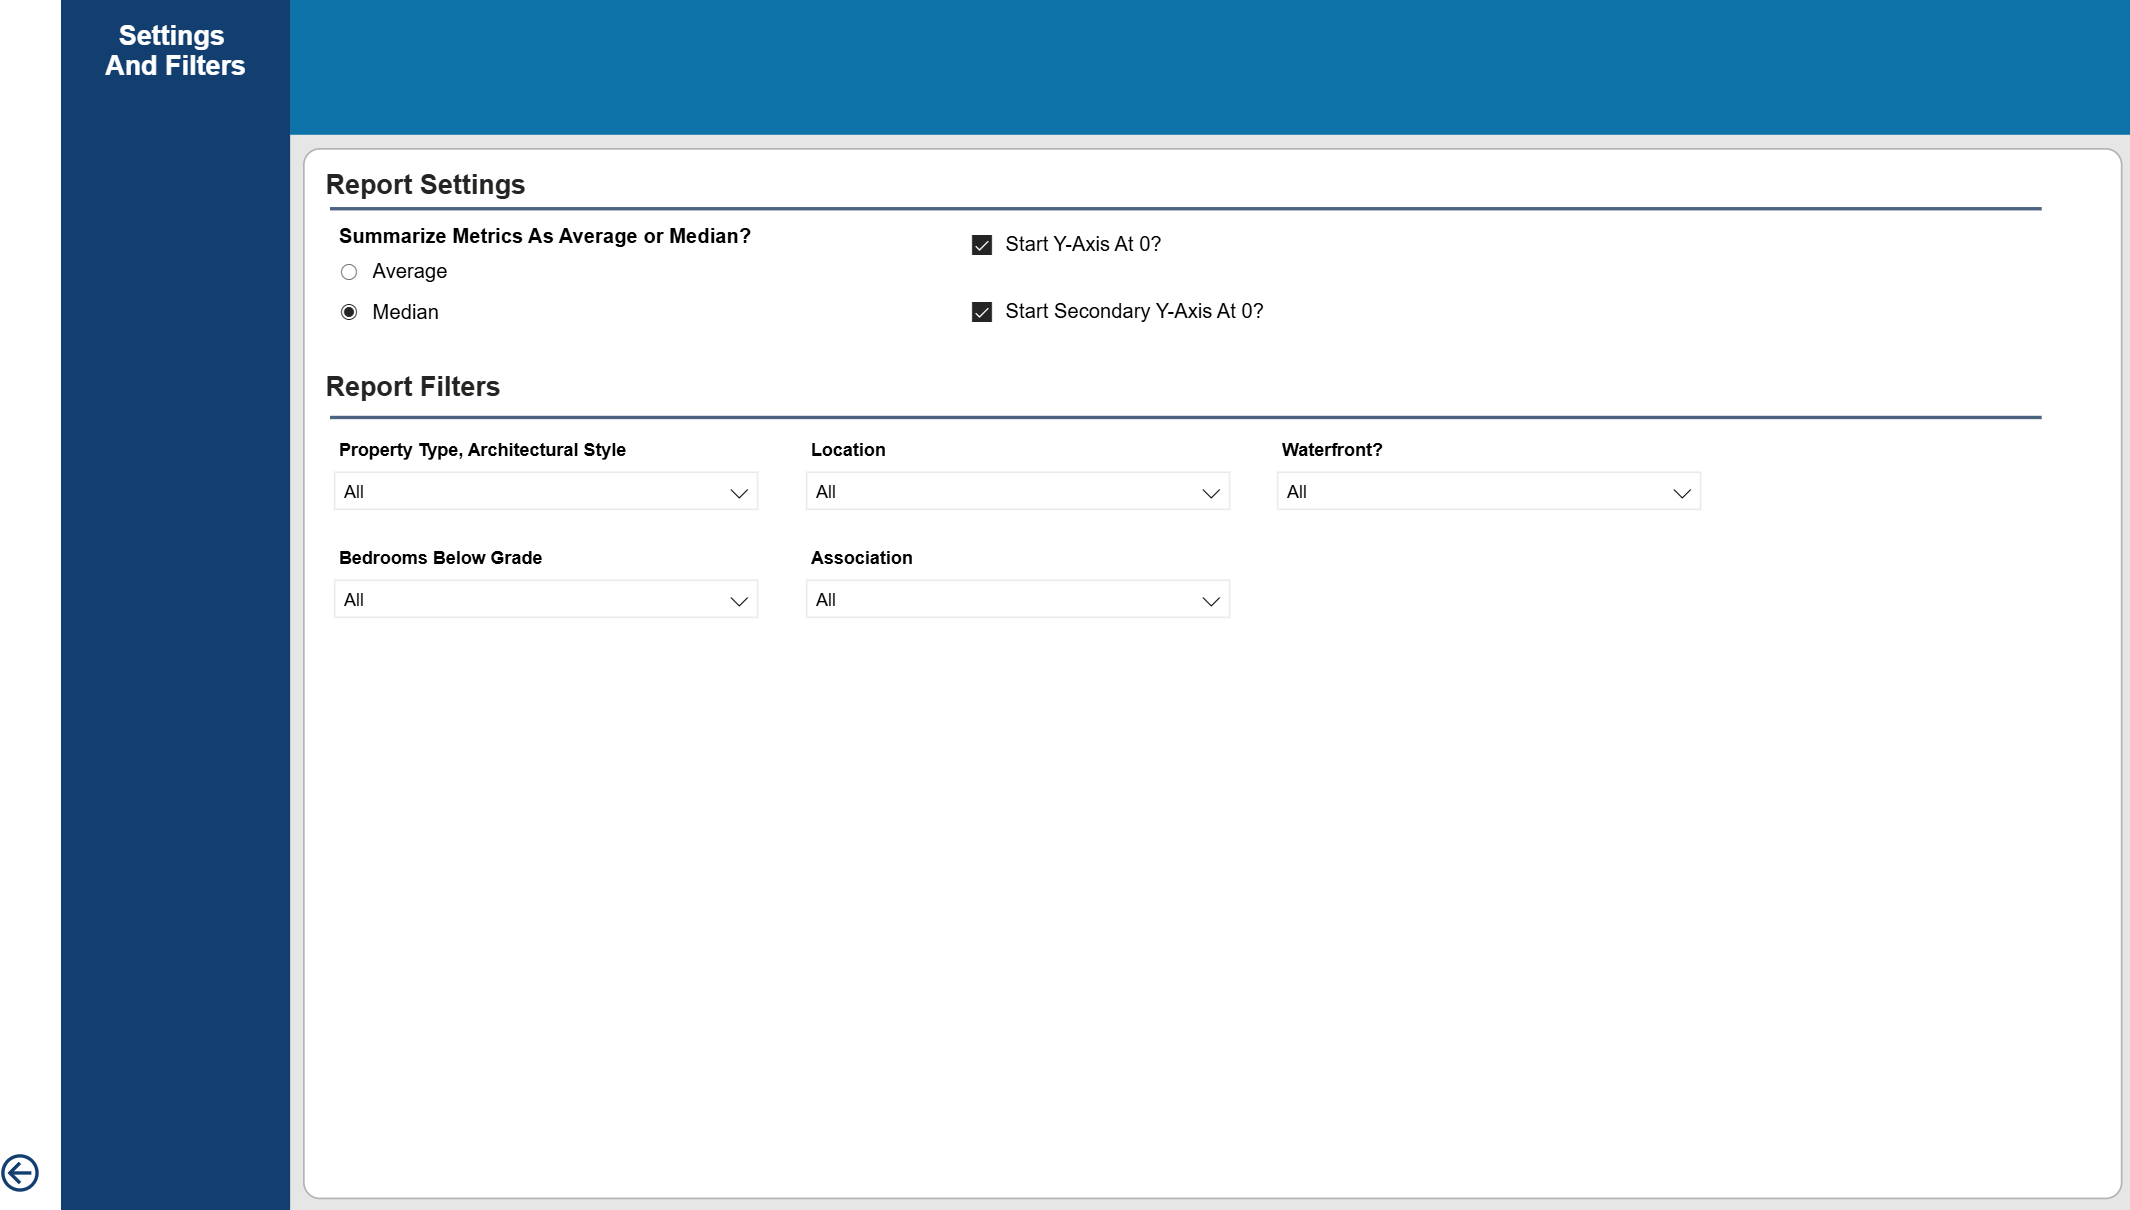
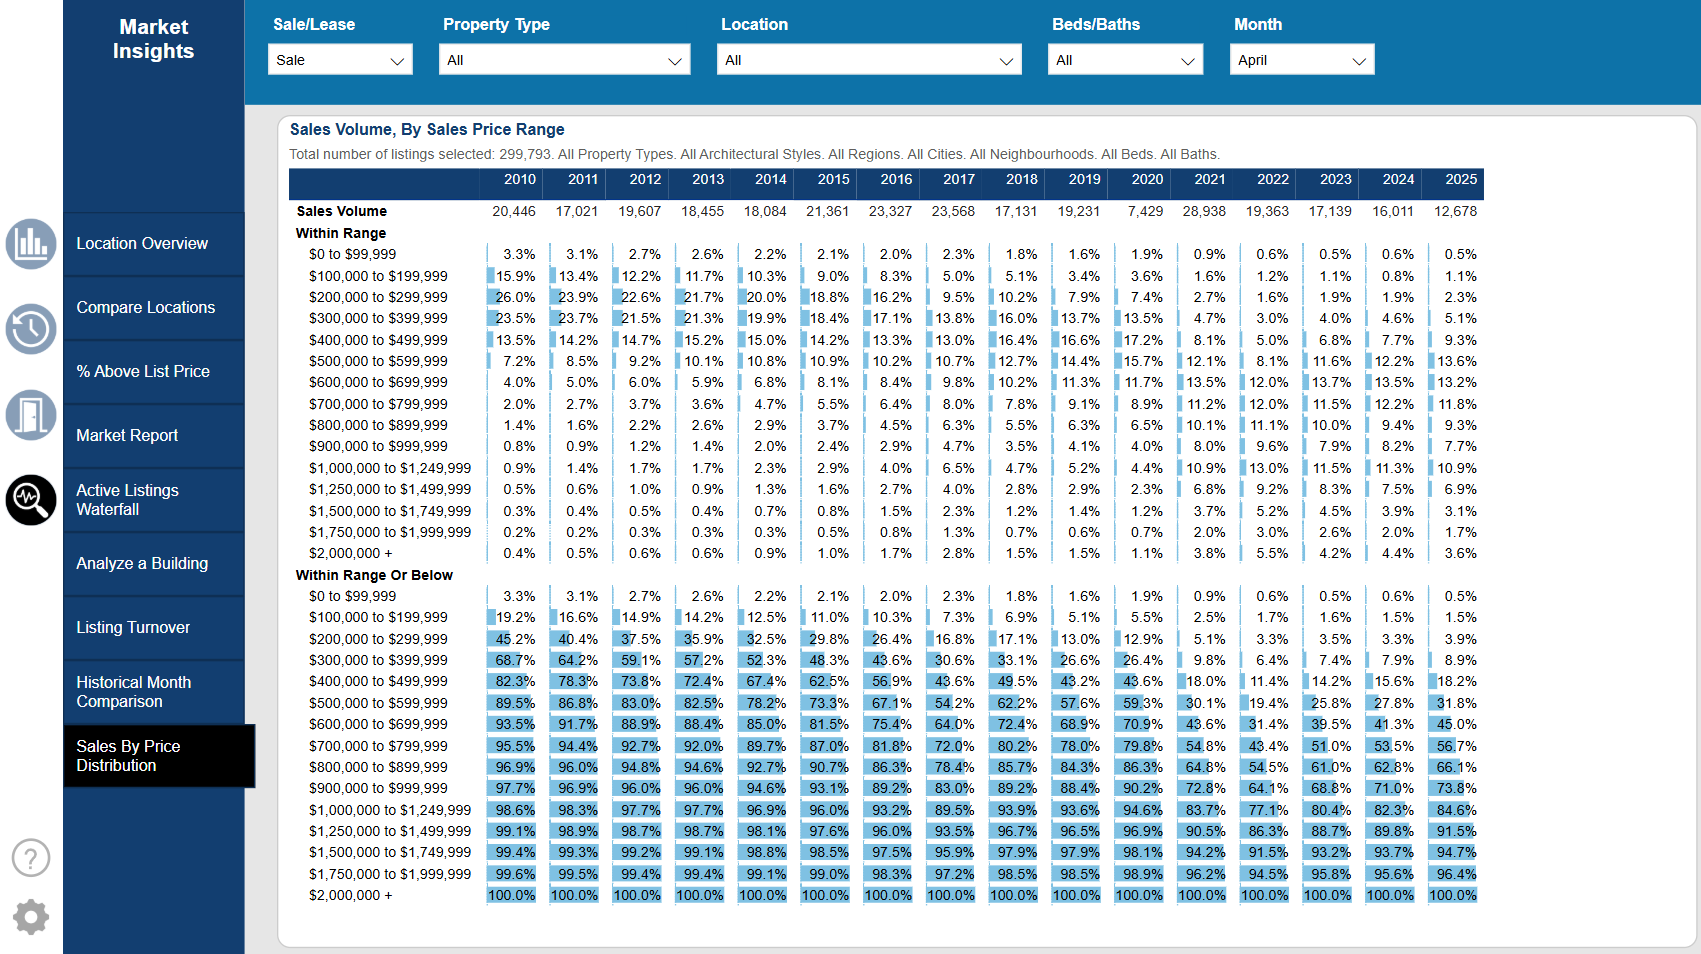
Users now have access to the Sales By Price Distribution Report in Market Insights.
Users can now use the Analytics Platform in Full Screen mode in desktop and mobile. Click Full Screen to enable and Escape on your keyboard (or back on mobile) to reduce the size.

Users can now export to CSV by going to the Historical Stats and/or Summary Stats page and clicking the ellipsis (three dots) on the top right of the visual followed by export data.